|
Impact of Value Creation on Stock
Prices: A Study of Amazon.Com, Inc

Esha
Jain (1)
Manish Madan
(2)
Sonia Singh (3)
(1) Dr.
Esha Jain, School of Management,
G. D. Goenka University, Gurgaon
(2) Prof. (Dr.) Manish Madan,
Rukmini Devi Institute of Advanced
Studies, Rohini, Delhi
(3) Dr. Sonia Singh, School of Business
(Adjunct Faculty)
Al Falah University, Dubai
Correspondence:
Dr.
Sonia Singh, School of Business (Adjunct
Faculty)
Al Falah University, Dubai
Email: sonia23singh@gmail.com
Abstract
The handwriting has been on the
wall for a long time, but a lacklustre
economy and ongoing financial turmoil
have underscored the broad trend that
has fundamentally altered how private
equity investors make money. Private
equity firms can no longer rely solely
on the power of leverage and ever-expanding
price-earnings multiples to generate
superior returns. More private equity
firms wielding more capital have bid
up acquisition prices, putting pressure
on potential investment gains. In
this study, one of the most common
indicators, Relative Strength Index
(RSI) was used to analyse the market
movements of Amazon.com, Inc. over
a period of the last 290 days. As
the study describes the existing price
movements of the selected company,
the research design followed was descriptive
and analytical research design. The
company was chosen completely on the
basis of convenient sampling technique
which is non-probability in nature.
This study is significant for investors
and traders as it leads to identify
the level of price movement that further
helps in understanding buying and
selling situations in the market by
identifying support and resistance
levels.
Key words: Market movements,
relative strength index, stock exchange,
value creation.
1. Introduction
Value creation is performance of actions
that increase the worth of goods,
services or even a business. Many
business operators now focus on value
creation both in the context of creating
better value for customers purchasing
its products and services, as well
as for shareholders in the business
who want to see their stake appreciate
in value. Value creation is a corporation's
raison d'être, the ultimate
measure by which it is judged. In
the 1990s, the main emphasis of executives
was on creating value for shareholders-a
value that was reflected in movements
of the company's stock price. But
measures based on stock market values
are subject to the same wild fluctuations
as the market itself. In a rising
tide, all boats get raised. But when
macroeconomic changes force up markets
generally, it does not mean that the
value of each individual company in
that market has changed similarly.
Markets are moved by sentiment that
has little to do with the underlying
value of individual corporations.(1)
Amazon strives to be Earth's most
customer-centric company where people
can find and discover virtually anything
they want to buy online. By giving
customers more of what they want -
low prices, vast selection, and convenience
- Amazon continues to grow and evolve
as a world-class e-commerce platform.
It is the largest Internet-based retailer
in the United States.(2)
Founded by Jeff Bezos, the Amazon.com
website started in 1995 as a place
to buy books because of the unique
customer experience the Web could
offer book lovers. Bezos believed
that only the Internet could offer
customers the convenience of browsing
a selection of millions of book titles
in a single sitting. During the first
30 days of business, Amazon fulfilled
orders for customers in 50 states
and 45 countries - all shipped from
his Seattle-area garage.(3)
Amazon's evolution from Web site to
e-commerce partner to development
platform is driven by the spirit of
innovation that is part of the company's
DNA. The world's brightest technology
minds come to Amazon.com to research
and develop technology that improves
the lives of shoppers and sellers
around the world. In 2015, Amazon
surpassed Walmart as the most valuable
retailer in the United States by market
capitalization. (4)
Amazon's stock is listed on NasdaqGS.
The NASDAQ Stock Market, commonly
known as the NASDAQ, is an American
stock exchange. It is the second-largest
exchange in the world by market capitalization,
behind only the New York Stock Exchange.
On July 1, 2006, the NASDAQ National
Market was renamed the NASDAQ Global
Market. In conjunction with this,
NASDAQ created the new NASDAQ Global
Select Market, a segment of the NASDAQ
Global Market with the highest initial
listing standards of any exchange
in the world. (5)
Footnotes
1. http://www.economist.com/node/14301714
2. Jopson, Barney (July 12, 2011).
"Amazon urges California referendum
on online tax". Financial Times.
3. https://www.linkedin.com/company/amazon
4. http://www.nytimes.com/2015/08/16/technology/inside-amazon-wrestling-big-ideas-in-a-bruising-workplace.html?_r=0
5. http://www.nasdaq.com/about/Top_Tier_Splash.stm
2. Review of
Literature
Errunza, V. R., & Losq, E.
(1985) investigated the behaviour
of stock prices for a group of well-established
and newly emerging LDC securities
markets and the derived results suggested
that the probability distributions
to be consistent with a lognormal
distribution with some securities
exhibiting non-stationary variance.
LDC markets, even though not as efficient
as major DC markets, are quite comparable
to the smaller European markets and
the behaviour of security prices as
reported in their study appears to
be generalizable for the heavily traded
segments of LDC markets.
Jegadeesh, N., & Titman, S.
(1993) documented that strategies
which buy stocks that have performed
well in the past and sell stocks that
have performed poorly in the past
generate significant positive returns
over a 3 to 12 months holding period.
They found that the profitability
of those strategies (Returns of Relative
Strength Portfolios) were not due
to their systematic risk or to delayed
stock price reactions to common factors.
The returns of the zero-cost winners
minus losers' portfolio were examined
in each of the 36 months following
the portfolio formation date. With
the exception of the first month,
the portfolio realized positive returns
in each of the 12 months after the
formation date. However, the longer
term performances of these past winners
and losers revealed that half of their
excess returns in the year following
the portfolio formation date dispatch
within the following two years.
Pruitt, S. W., & White, R.
E. (1988) attempted to directly
determine the profitability performance
of a multi-component technical trading
system incorporating price, volume,
and relative strength indicators on
individual security issues. The system
they tested, to which they had given
the acronym CRISMA to represent its
component parts (Cumulative Volume,
Relative Strength, Moving Average),
is completely ex-ante in nature and
outperformed the market over a significant
interval of time, even after adjusting
for problems of trade timing and risk,
and after allowing for round-trip
transaction costs up to 2% per security
trade.
Tsaih, R., Hsu, Y., & Lai,
C. C. (1998) presented a hybrid
AI (artificial intelligence) approach
to the implementation of trading strategies
in the S&P 500 stock index futures
market. The hybrid AI approach integrates
the rule-based systems technique and
the neural networks technique to accurately
predict the direction of daily price
changes in S&P 500 stock index
futures. Based upon this hybrid AI
approach, the integrated futures trading
system (IFTS) was established and
employed to trade the S&P 500
stock index futures contracts. Empirical
results also confirmed that IFTS outperformed
the passive buy-and-hold investment
strategy during the 6-year testing
period from 1988 to 1993.
Amit, R., & Zott, C. (2000)
explored the theoretical foundations
of value creation in e-business by
examining how 59 American and European
e-businesses became publicly traded
corporations create value and observed
that in e-business, new value can
be created by the ways in which transactions
are enabled. Developed a model based
on study, they suggested that the
value creation potential of e-businesses
hinges on four interdependent dimensions,
namely: efficiency, complementarities,
lock-in, and novelty. They also found
that no single entrepreneurship or
strategic management theory can fully
explain the value creation potential
of e-business.
Gunasekarage, A., & Power,
D. M. (2001) analysed the performance
of one group of these trading rules
using index data for four emerging
South Asian capital markets (the Bombay
Stock Exchange, the Colombo Stock
Exchange, the Dhaka Stock Exchange
and the Karachi Stock Exchange) and
examined the implications of the results
for the weak form of the efficient
market hypothesis. The findings indicated
that technical trading rules have
predictive ability in these markets
and rejected the null hypothesis that
the returns to be earned from studying
moving average values are equal to
those achieved from a naive buy and
hold strategy.
Hameed, A., & Kusnadi, Y. (2002)
analysed that the momentum returns
of more than 1 percent per month is
observed when applied to less diversified
portfolios consisting of firms with
small market capitalization or high
volume of trade, suggesting that price
momentum is related to firm specific
factors.
Wong, W. K., Manzur, M., &
Chew, B. K. (2003) focused on
the role of technical analysis in
signalling the timing of stock market
entry and exit. Test statistics were
introduced to test the performance
of the most established of the trend
followers, the Moving Average, and
the most frequently used counter-trend
indicator, the Relative Strength Index.
Using Singapore data, the results
indicated that the indicators can
be used to generate significantly
positive return. It was also found
that member firms of Singapore Stock
Exchange (SES) tend to enjoy substantial
profits by applying technical indicators
and concluded it as the main reason
why most member firms do have their
own trading teams that rely heavily
on technical analysis.
Wang, C. (2004) examined among
national stock prices of four Asian
Newly Industrializing Countries stock
markets - Taiwan, South Korea, Singapore
and Hong Kong - in models incorporating
the established markets of Japan,
USA, UK and Germany. The results consistently
appear to suggest the relatively leading
role of all established markets in
driving fluctuations in the NIC stock
markets. In other words, all established
markets and Hong Kong, consistently
were the initial receptors of exogenous
shocks to the (long-term) equilibrium
relationships and the other NIC markets,
particularly the Singaporean and Taiwanese
markets had to bear most of the burden
of short-run adjustment to re-establish
the long-term equilibrium relationship.
In comparison to all other NIC markets,
Taiwan and Singapore appear as the
most endogenous, with Taiwan providing
evidence of its short-term vulnerability
to shocks from the established markets.
Pan, R. K., & Sinha, S. (2007)
analysed the cross-correlation
matrix C of stock price fluctuations
in the National Stock Exchange (NSE)
of India to investigate the universality
of the structure of interactions in
different markets and found that this
emerging market exhibits strong correlations
in the movement of stock prices compared
to developed markets, such as the
New York Stock Exchange (NYSE). This
showed the dominant influence of a
common market mode on the stock prices.
By comparison, interactions between
related stocks, were found to be much
weaker. This lack of distinct sector
identity in emerging markets was explicitly
shown by reconstructing the network
of mutually interacting stocks. Spectral
analysis of C for NSE revealed that
the few largest eigenvalues deviate
from the bulk of the spectrum predicted
by random matrix theory, but they
were far fewer in number compared
to, e.g., NYSE. They showed this due
to the relative weakness of intra-sector
interactions between stocks, compared
to the market mode, by modelling stock
price dynamics with a two-factor model.
They also suggested that the emergence
of an internal structure comprising
multiple groups of strongly coupled
components is a signature of market
development.
3.
Objectives of the Study
The main objective of the study is
to do relative strength analysis,
with the help of RSI indicator, of
a particular scrip to interpret buying
and selling conditions in the market.
Also the objective of the study is
to analyse price movements over a
period of last 290 days.
4. Research
Methodology
The study aims at analysing the price
movements of Amazon.com, Inc. over
a period of last 290 days and as the
study describes the existing price
movements of the selected company,
the research design followed was descriptive
and analytical research design. The
company was chosen completely on the
basis of convenient sampling technique
which is non-probability in nature.
This study is significant for investors
and traders as it leads to identify
the level of price movement that further
helps in understanding buying and
selling situations in the market by
identifying support and resistance
levels. To achieve the desired objective,
the daily share price movements of
the selected company was absorbed
for 290 days, i.e. from 1st April
2015 to 15th January 2016. As the
company is listed on NasdaqGS (NASDAQ
Global Select Market) so the data
was collected from the website of
Nasdaq and Bloomsberg. After that,
the closing prices of share prices
were taken and the future price movement
was analysed using Relative Strength
Index Indicator of technical analysis.
Data was collected as available on
Nasdaq and Bloomsberg website as on
16th January 2016-evening.
5. Data Analysis
and Interpretations
The data was analysed by using Relative
Strength Analysis, the most common
and reliable indicator of technical
analysis of stock markets. Relative
Strength Index (RSI) is a popular
momentum oscillator developed by J.
Welles Wilder Jr. It is not to be
confused with relative strength, which
compares a stock's price performance
to that of an overall market average,
such as the S&P 500. Instead,
the RSI analyses the recent performance
of a security in relation to its own
price history. RSI is a valuable tool
to determine overbought/oversold levels.
The Relative Strength Index compares
upward movements in closing price
to downward movements over a selected
period. Wilder originally used a 14
day period, but 7 and 9 days are commonly
used to trade the short cycle and
21 or 25 days for the intermediate
cycle. The RSI value will always move
between 0 and 100; the value will
be 0 if the stock falls on all 14
days, and 100, if the price moves
up on all the days. This implies that
the RSI can also be used to identify
the overbought/oversold levels in
a counter. As suggested by J Welles
Wilder, the developer of this indicator,
most technical analysts consider the
RSI value above 70 as 'overbought
zone' and below 30 as 'oversold zone'.
However, investors and traders need
to adjust these levels according to
the inherent volatility of the scrip.
It is computed on the basis of the
speed and direction of a stock's price
movement. This means that the RSI
indicator only measures the stock's
internal strength (based on its past)
and should not be confused with its
relative strength, that is compared
with other stocks, market indices,
sectoral indices, etc.
Table 1 shows the Relative Strength
Index for each day on the basis of
14-day RSI technique from 1st April
2015 to 15th January 2016.
Table 1: Showing Relative Strength
Analysis on the basis of 14-day RSI
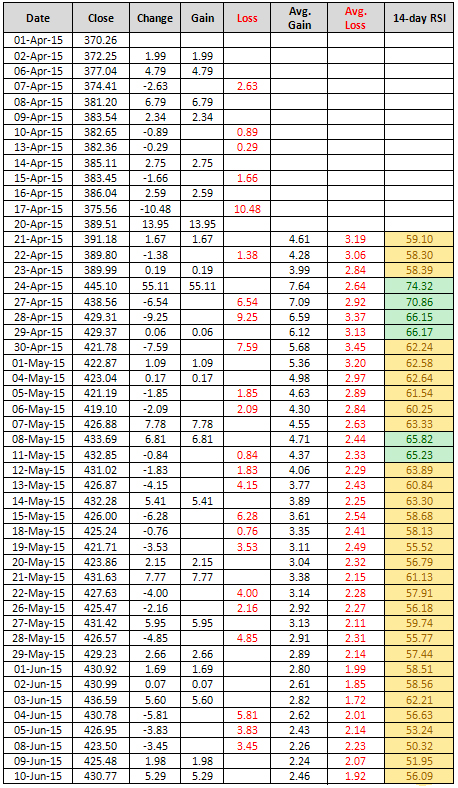
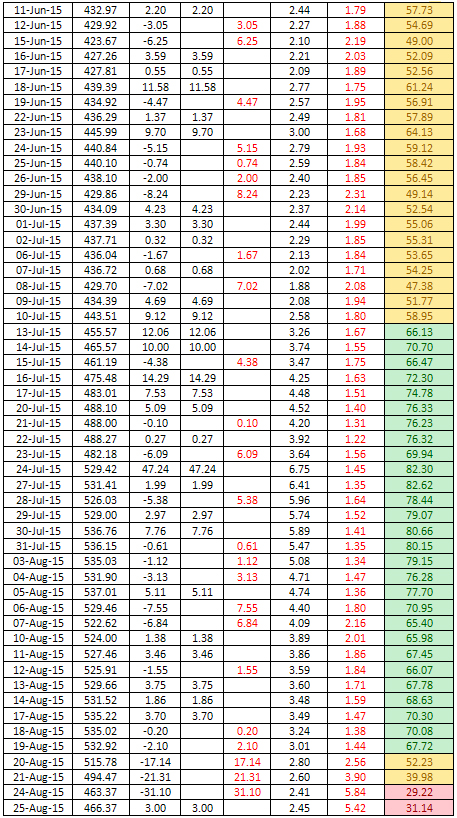
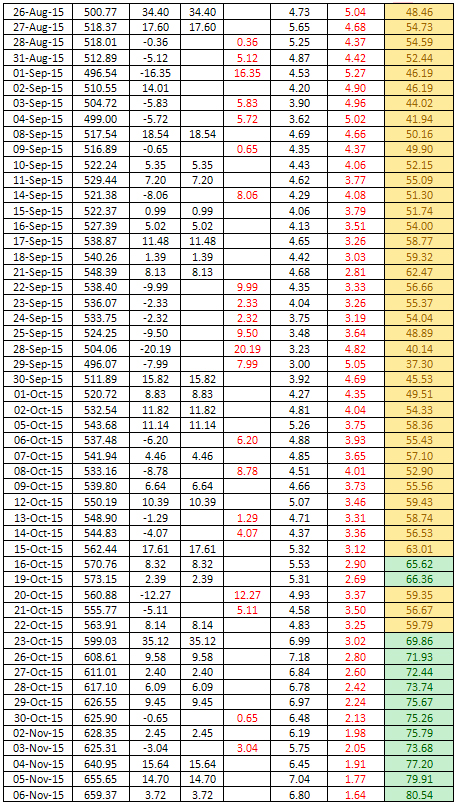
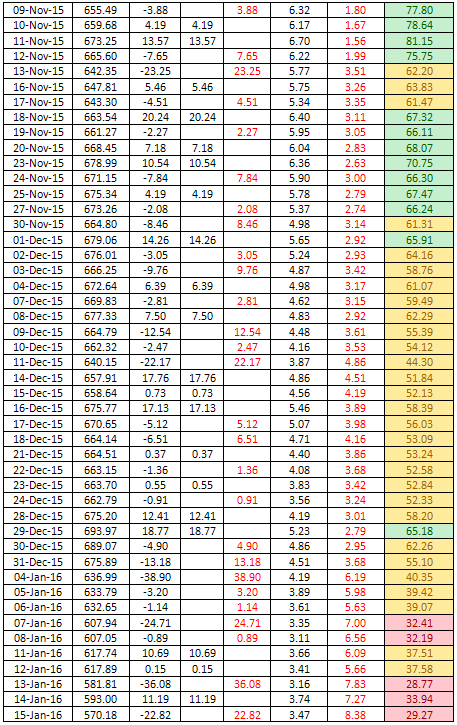
In this paper, signals are only tak
en in the direction of the trend with
the following conditions:
• Go long, in an up-trend, when
RSI falls below 35 and rises back
above it.
• Go short, in a down-trend,
when RSI rises above 65 and falls
back below it.
In the column of 14-day RSI in Table
1, the red cells show oversold zones,
green cells show overbought zones
and yellow cells show hold position.
According to Wilder, divergences signal
a potential reversal point because
directional momentum does not confirm
price. A bullish divergence occurs
when the underlying security makes
a lower low and RSI forms a higher
low. RSI does not confirm the lower
low and this shows strengthening momentum.
A bearish divergence forms when the
security records a higher high and
RSI forms a lower high. RSI does not
confirm the new high and this shows
weakening momentum.
Chart 1: Showing Relative Strength
Analysis with Support & Resistance
Levels
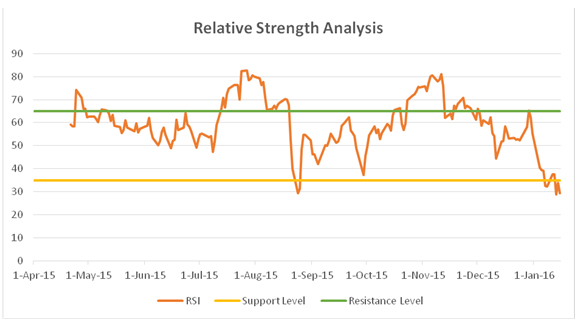
RSI forms patterns, such as triangles
or head and shoulders tops and bottoms.
Breakouts from these patterns on the
daily chart often precede the price
breakout by one or two days -- providing
the swing trader valuable advance
notice. Chart 1 shows Amazon.com,
Inc. with a bullish divergence in
the first month of financial year
(April 2015) showing the stock in
overbought zone on 24th April 2015.
Then suddenly for a week from 30.04.2015
to 07.05.2015, the stock formed a
bearish divergence to some extent
for saving the stock from overbought
zone. After two days the stock again
came in normal mode. Then, the stock
price moved to new high from mid-July
to mid-August 2015 as well as RSI
formed a bullish divergence which
further leads to crossing of resistance
level, showing overbought zones.
But on 20th August 2015, suddenly
all the investors start selling the
shares of the company and the shares
came in oversold zones within two
trading days and the scrip gave clear
indication of buying as it is expected
that prices will definitely increase
in the near future. During the above
mentioned two-days, the prices of
the shares fall by US$69.55 from US$532.92
to US$463.37 per share. The prices
fell down suddenly during this period
due to the news spread all over about
the 'brutal' work treatment in Amazon
which became headlines of leading
newspapers and news channels viz.
CNN Money(6),
New York Times(7),
BBC News(8,9),
Washington Post(10),
etc.
The indication of buying of shares
as shown by RSI values comes to practical
ground when on 26th August 2015, the
share price again rose to US$500.77
per share and US$518.37 per share
on 27th August 2015. The prices of
the shares moved to US$548.39 per
share till 21st September 2015 which
generated huge profits for the investors
who invested on those two trading
days near 20th August 2015. During
this period, the RSI values formed
various bullish and bearish divergences
but all trading were in the range
of 35 and 65. Then on 23rd of October
2015, the RSI values again showed
overbought zones due to high demand
of investors over previous days. The
stock was in overbought zones till
around 1st December 2015 and then
the prices moved to normal position.
But, now since 7th January 2016, the
stock is showing in oversold zones,
i.e. the investors are selling its
shares in a huge amount. On the last
trading day of period concerned i.e.
on 15th January 2016, the prices of
the shares fell by US$22.82 per share.
6. http://money.cnn.com/2015/08/17/technology/amazon-nytimes/
7. http://www.nytimes.com/2015/08/16/technology/inside-amazon-wrestling-big-ideas-in-a-bruising-workplace.html?_r=0
8. http://www.bbc.com/news/business-33957484
9. http://www.bbc.com/news/magazine-33988479
10. https://www.washingtonpost.com/news/the-switch/wp/2015/08/17/is-it-really-that-hard-to-work-at-amazon/
6. Conclusion
The study was done over a period of
290 days with the help of RSI indicator
out of which the trading was opened
for 194 days, rest of the days were
weekends and other holidays on which
stock market was closed. From the
study, it was analysed that the stock
prices of Amazon.com, Inc. over a
said period of time was moved from
a period low of US$368.34 on 1st April
2015 to a period high of 696.44 on
29th December 2015 which shows a huge
positive change in market capitalisation.
It was further concluded that business
begins with value creation. It is
the purpose of the institution: to
create and deliver value in an efficient
enough way that it will generate profit
after cost because value creation
is the starting point for all businesses,
successful or not; it's a fundamental
concept to understand as proved by
the analysis, effect of timely news
and data shown.
References
Amit, R., & Zott, C. (2000). Value
creation in e-business. INSEAD.
Errunza, V. R., & Losq, E. (1985).
The behavior of stock prices on LDC
markets. Journal of Banking &
Finance, 9(4), 561-575.
Gunasekarage, A., & Power, D.
M. (2001). The profitability of moving
average trading rules in South Asian
stock markets. Emerging Markets Review,
2(1), 17-33.
Hameed, A., & Kusnadi, Y. (2002).
Momentum strategies: Evidence from
Pacific Basin stock markets. Journal
of financial research, 25(3), 383-397.
Jegadeesh, N., & Titman, S. (1993).
Returns to buying winners and selling
losers: Implications for stock market
efficiency. The Journal of finance,
48 (1), 65-91.
Pan, R. K., & Sinha, S. (2007).
Collective behavior of stock price
movements in an emerging market. Physical
Review E, 76(4), 046116.
Pruitt, S. W., & White, R. E.
(1988). The CRISMA trading system:
Who says technical analysis can't
beat the market?. The journal of portfolio
management, 14(3), 55-58.
Tsaih, R., Hsu, Y., & Lai, C.
C. (1998). Forecasting S&P 500
stock index futures with a hybrid
AI system. Decision Support Systems,
23(2), 161-174.
Wang, C. (2004). Relative strength
strategies in China's stock market:
1994-2000. Pacific-Basin Finance Journal,
12(2), 159-177.
Wong, W. K., Manzur, M., & Chew,
B. K. (2003). How rewarding is technical
analysis? Evidence from Singapore
stock market. Applied Financial Economics,
13(7), 543-551.
|